Research question
How might US technology-sector output develop through 2029?
Econometric research · Forecasting
A production-function approach to estimating the historical performance and future outlook of US technology-sector GDP using structural and inertial forecasting methods.
How might US technology-sector output develop through 2029?
NAICS 334: Computer and Electronic Products Manufacturing + NAICS 51: Information
Historical performance through 2024, forecasts for 2025-2029
This project examines how capital, labor, and sector-specific dynamics contribute to US technology-sector output. The sector is defined as an identity of NAICS 334: Computer and Electronic Products Manufacturing plus NAICS 51: Information.
The analysis combines historical review, a theoretical production function, and competing forecasting approaches to compare how different assumptions shape the technology sector's outlook.
The structural model reinforced the central role of capital and labor as driving forces in the technology sector's production function. Inertial models are fast and often provide reasonable forecasts, but they do not capture the nuanced dynamics represented by the structural model.
This model includes 3 possible outcomes: optimistic, baseline, and pessimistic scenarios, each reflecting different assumptions about capital, labor, and sector-specific dynamics. This set allows for clear bracketing of potential future developments in the technology sector, giving the clearest picture of what may lie ahead.
Model structure
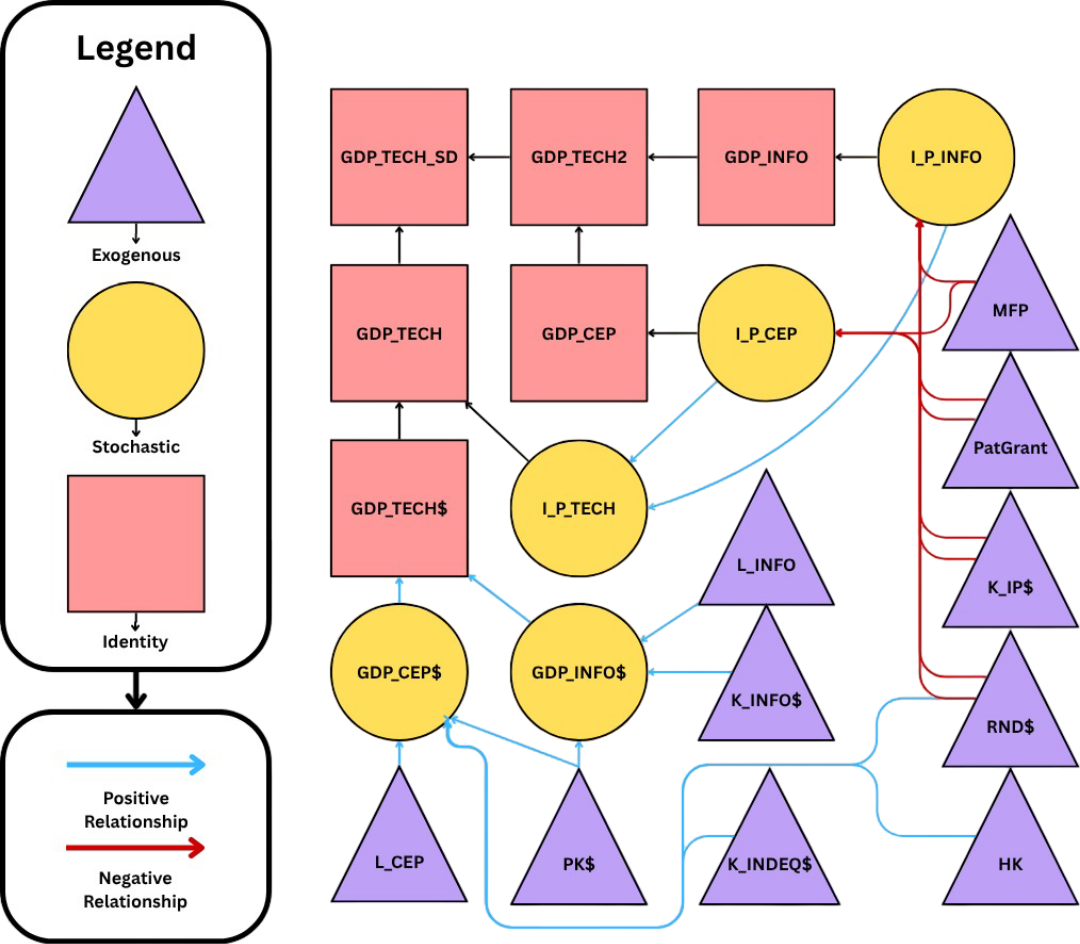
Primary visual
| Year | Base | Pess. | Opt. |
|---|
Real GDP levels, with base, pessimistic, and optimistic scenarios. Growth rates are calculated year over year from the level data.
Downloads
Access the original modeling workbook, supporting data, presentation, and full project report.